Business Graph of Company Data
The high-level project goals of euBusinessGraph were:
- To make company data more accessible, more usable and easier to understand
- To make it easier for company data providers to publish and distribute their data
- To make it easier for data consumers to find and access company data needed for their businesses
To achieve these goals we developed:
- A “business graph” – a highly interconnected graph of Europe-wide company-related information both from authoritative and non-authoritative sources (including data both from the public and private sector).
- A reliable data provisioning of the business graph in the form of a data marketplace that in turn enables the creation of a set of data-driven products and services via a set of corresponding business cases. The data insights generated by the proposed products and services will in turn feed the generated data insights back into the business graph, ensuring that information collected and aggregated within the graph is sustainable and of high value.
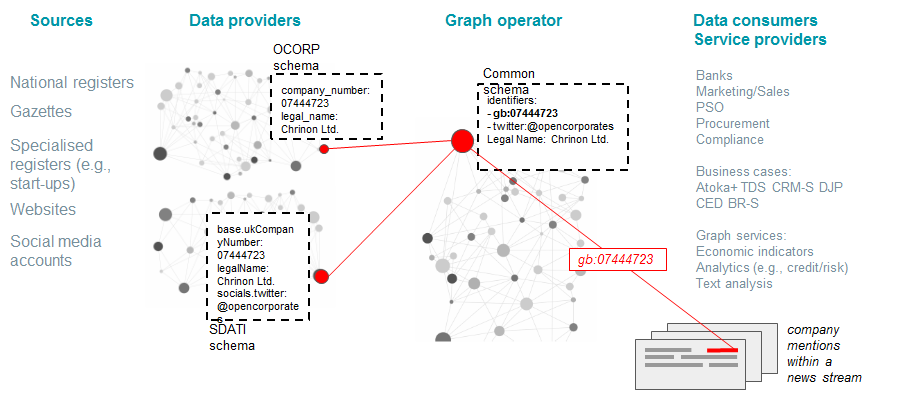
Representing company data
Existing initiatives to increase the interoperability and access of corporate data are mostly fragmented (across borders), limited in scope and size, and silo-ed within specific business communities with limited accessibility from outside their originating sectors and countries. As a result, collecting and aggregating data about a business entity from several public sources (be it private/public, official or non-official ones), and especially across country borders and languages is a tedious, time consuming, error prone, and very expensive operation which renders many potential business models non-feasible.
euBusinessGraph represents a key initiative to simplify and disrupt the cross-border and cross-lingual collection, reconciliation, aggregation, and provisioning and analytics of company-related data from authoritative and non-authoritative public or private sector sources, with the aim of enabling cross-sectorial innovation. By a combination of large companies, SMEs, public organizations, and technology transfer providers euBusinessGraph sets the foundations of a European cross-border and cross-lingual “business graph”, aggregating, linking, and provisioning (open and non-open) high-quality company-related data, demonstrating innovation across sectors where company-related data value chains are relevant.
The euBusinessGraph has drawn on the experience of its data providers and technology providers to tackle the complex task of combining company data from multiple sources. We have defined a common semantic model (ontology) to represent companies and their attributes in a consistent way.
Why company-related data?
- Core asset in digitalization of business and society
- Serves as a foundation of many data value chains
- High societal significance (transparency, accountability)
Corporate information, including basic company firmographics (e.g., name(s), incorporation data, registered addresses, ownership and related entities), financials (e.g., balance sheets, ratings) as well as contextual data (e.g., cadastral data on corporate properties, geo data, data about directors and shareholders, public tenders data, press mentions) are the foundation that many data value chains are built on. Furthermore, this type of information contributes to the transparency and accountability of enterprises, is instrumental input to the process of marketing and sales, and plays a key role in many business interactions.
Examples of company data usage
- Predict the behaviour of a company
- Will company X buy new products, open a new office?
- Recommendation systems
- If you are interested in company X you may also be interested in Y
- Network analysis
- Building corporate network, influence of people in companies
- Statistical models
- Computing credit score
- Fact extraction
- Company X has launched a new product or service
- Company X established a partnership with Company Y
- Data quality problems and data profiling
- Combining data can surface inconsistencies and contradictions
Provisioning of the Business Graph
Overview of the key components
An overview of the key components of the project is provided in the figure below, depicting the connection between data consumers and providers of the business graph data, through the enhanced environment developed in euBusinessGraph. In the process of transforming, integrating, publishing, and reusing data, two types of data value chains are created as depicted in the picture, and discussed below.
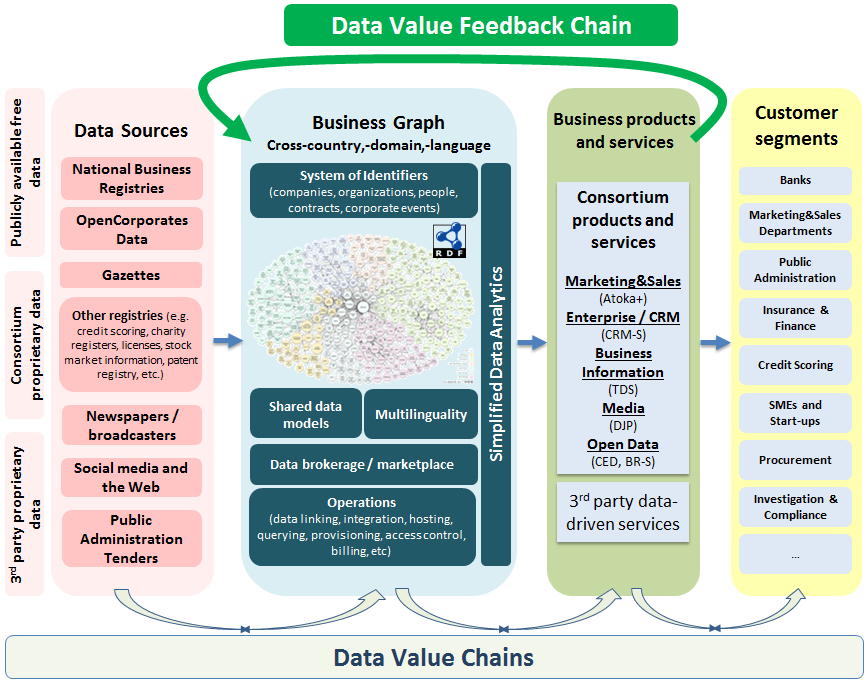
The Data Sources component (the left part of the figure) is represented by the various datasets and data sources that will be integrated and used in populating the business graph.
- National Business Registries: Data from authoritative business registries providing official information about companies at the national level (e.g., identifiers of companies, addresses, industry codes, etc.)
- Gazettes: Public records of company-related legal notices.
- Other registries: Data from registries created in various sector such as credit bureau registries, charities, licenses, stock markets, patent registries, etc.
- OpenCorporates: Open data about over 92 million companies, primarily collected from public sources.
- Newspapers/broadcasters: Unstructured company-related data from media sources in various languages.
- Social media and the Web: Unstructured or semi-structured company-related data form companies’ websites and social media.
- Public Administration Tenders: data about companies participating in public tenders.
The Business Graph component (the second from the left in the figure) is a core element of euBusinessGraph, which addresses two main aspects:
(1) Design of the business graph, including creation/maintenance of a system of identifiers for company-related data, development of shared data models, multi/cross-lingual aspect;
(2) Reliable provisioning of the business graph, including support for data transformations, onboarding, hosting, access, analytics, data marketplace, and operations.
The Business products and services component (the second from the right in the figure) will access and use the data made available in the business graph for creation of data-driven products and services.
The Customer segments component (the first from the right in the figure) is represented by customer segments of the products and services that are created at the business products and services layer. This focus here is on the value created to the end users of the business products and services. The core customers segments targeted by the euBusinessGraph products and services are depicted in the figure.
The Data Value Chains enabled by euBusinessGraph are twofold:
- Data value chain #1 – from silo-ed data sources to customer segments (at the bottom of the figure): the value chain spans from the silo-ed data sources to various customer segments. The value is created through the set of capabilities provided by the business graph provisioning infrastructure, which are in turn leveraged to establish a set of innovative business products and services
- Data value chain #2 – data value feedback chain (at the top of the figure): consists of the data insights generated by the proposed products and services being fed back into the business graph, therefore enhancing the value and scope of the data in the business graph. This is euBusinessGraph’s mechanism to ensure that the business graph can host highly valuable and high-quality information, while at the same time increasing the chances of a self-sustainable business graph.
Credits: Graph Image (By Anjeve, Richard Cyganiak – Own work, CC BY-SA 3.0, https://commons.wikimedia.org/w/index.php?curid=11850349)
